The U.S. Environmental Protection Agency publishes the climate report that Trump has hidden
“Climate indicators show how climate change affects the environment and people’s health”
[13 Maggio 2021]

For the first time in 4 years the EPA (The Environmental Protection Agency) reposts you Indicators of climate change in the United States On his public website, he states, “This comprehensive resource provides compelling and clear evidence of changes in our climate that are reflected in rising temperatures, ocean acidity, sea level rise, river floods, droughts, heat waves and fires, among other indicators.”
What the EPA is not saying diplomatically is that these are the same data in the report that was “delayed” to be published by the climate denier Donald Trump administration as of 2017. Vital information whose consultations have now improved thanks to interactive data exploration tools that provide a hard look at the fees. Charts, maps and photos, along with an overview of the importance of indicators and how climate change may affect human health and the environment.
EPA Director Michael Reagan stressed, “The EPA Climate Indicators website is a critically important scientific resource that underscores the urgent need for action on the climate crisis. With this long-awaited update, we now have additional data and a new set of Indicators show that climate change is becoming more evident, stronger and more extreme, as well as the need for targeted action.
The Trump administration has never updated the EPA’s Climate Change Indicators website, as has the Barack Obama administration always. But an EPA press officer reminded BBC Even this report, “the agency never – not even during the Obama years – attributed global warming, at least in part, to human activities.” Instead, Reagan, in announcing the re-release of the data update, emphasized that “Fighting climate change is not optional. It is essential for the EPA. We will act with a sense of urgency because we know what is at stake. Climate facts are back on the EPA website where It should be. Given the urgency of this crisis, it is imperative that Americans have access to information and resources so that we can all play a role in protecting our environment, health, and vulnerable societies. Reliable and science-based information supports robust and achievable solutions. The Biden Harris administration has made it clear that Tackling climate change is a national priority.In the coming weeks and months, the EPA will add new and updated information about the science of climate change, its impacts, what the EPA is doing and what you can do, providing a reliable and accurate public resource about problems and solutions. Climate change leads to rising sea levels, receding snow and ice, and changes in the frequency and intensity of heat waves, precipitation, and extreme weather events. Global warming caused by human activities is changing the climate at a pace and in a way that threatens human health, society and the natural environment. Children, the elderly and the poor are among the groups most vulnerable to climate-related health impacts. ”
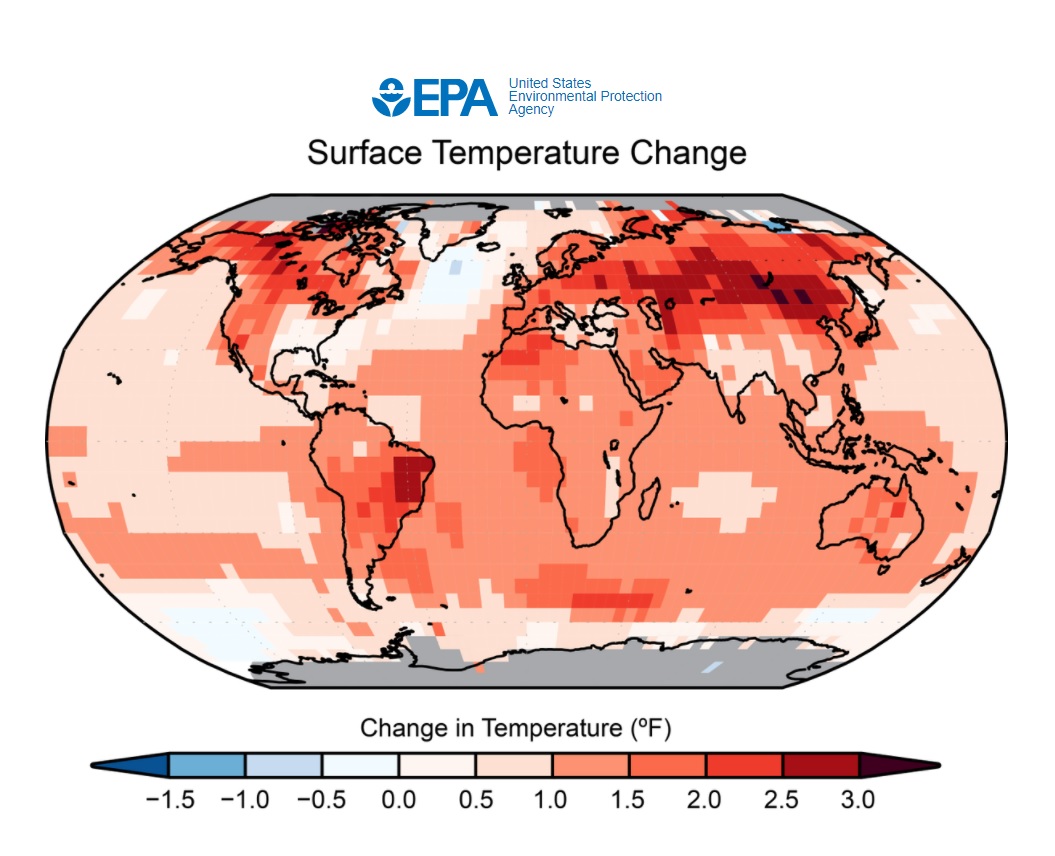
To develop climate change indicators, the EPA works with more than 50 data contributors from various government agencies, academic institutions, and other organizations. Each indicator has been reviewed by independent experts. Here are the EPA pointers that Trump wanted Americans not to show:
Global temperature – 2016 was the hottest year on record, 2020 was the second warmest year, and the decade 2001-2020 was the hottest on record since 1880, when observations began. Since 1991, cases of tick-borne Lyme disease have nearly doubled. Ticks are now found in areas of northern USA and southern Canada where they previously could not survive the cold. Ocean temperatures are also at a record high in 2020, and the waters have become more acidic over the past 10 years.
Arctic sea ice – The September 2020 sea ice stretch was the second smallest area ever recorded. It was less than 900,000 square miles from the historic 1981-2010 average for that month, three and a half times the size of Texas.
Ice shelves – Since 1992, both Greenland and Antarctica have lost ice, each losing an average of more than 100 billion tons of ice annually and accounting for about a third of the global sea level rise observed between 2006 and 2015.
Heat waves in US cities – Heat waves occur most often in the United States. Their frequency increased steadily, from an average of two heat waves per year during the 1960s to 6 waves per year during the 2000s. The amount of energy used in the summer has nearly doubled since 1973. In 2015, air conditioning accounted for 17 percent of the average energy consumption of an American household.
Sea level in the United States – Sea level rose (relative to the mainland) along much of the coast of the United States between 1960 and 2020, particularly the mid-Atlantic coast and parts of the Gulf Coast, with some stations experiencing increases of more than 8 Inches.
Coastal Floods – Tidal floods are becoming more frequent at most locations along the eastern and Gulf coasts.
Growth Season Length – The average length of the growing season has increased in the 48 neighboring states for more than two weeks since the beginning of the 20th century. Fire season and pollen season start early and last longer.
Marine Species Distribution – Along with warming ocean waters, many marine species off the coast of the United States are turning north and heading towards deeper waters. Changes have occurred between several economically important species of fish and mollusks.

Rachel Montgomery is a contributor at Prudent Press Agency, covering a wide range of topics including news, politics, business, technology, sports, entertainment, and lifestyle. She focuses on delivering clear, accurate, and reader-focused reporting that helps audiences stay informed about current events and important developments. Her work emphasizes useful information, balanced coverage, and stories that matter to everyday readers, making complex topics accessible and relevant.